The probability of an El Niño event is currently (beginning of November 2018) estimated at at least 70% from November 2018 to March 2019. The first concern amongst most roleplayers is the impact which the event had on rainfall and the poor yields during the 2015/2016 season.
This potential reality forced us to evaluate the ENSO (El Niño Southern Oscillation) phenomenon in perspective by looking at the impact thereof on the central and western production area. As part of the discussion it would be sensible to relook at the basic background to such a phenomenon and how it is determined. This article accordingly focuses on the background which will form the basis for follow-up articles regarding the intensity of the ENSO-phenomenon and the impact thereof on the central and western production area.
El Niño and La Niña phenomena are global weather phenomena. They originate in the Pacific Ocean when the atmospheric pressure between the island of Tahiti and Darwin (Northern Australia) varies. The measurement of the difference in atmospheric pressure between the two points of reference is done by means of the SOI (Southern Oscillation Index). The difference in atmospheric pressure results in trade winds which normally blow from the east to the west across the Pacific Ocean, no longer following this pattern. During an El Niño-event the atmospheric pressure changes to the extent where trade winds weaken or even change direction, which results in warmer than normal sea surface temperatures over the central and eastern tropical Pacific Ocean.
This phenomenon goes hand in hand with an increased chance of below normal rainfall over the western areas of South Africa and particularly the inland areas of Eastern Australia. However, the opposite phenomenon, namely La Niña, goes hand in hand with above average strong trade winds which cause warmer than normal sea surface temperatures over the northern areas of Australia, with an increased chance of above normal rainfall over Australia and South Africa.
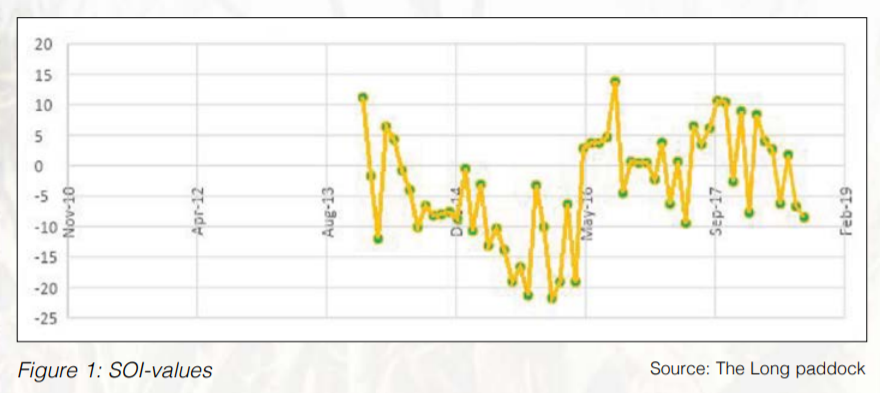
Research over time has developed to the extent where various models can be implemented to determine the probability of either an El Niño or La Niña phenomenon. The first indication of the development of the phenomena is usually the changed SOI-values. Should the SOI values be higher than +7 for an extended period of time, the probability of a La Niña (wetter production season) increases. The probability of the opposite El Niño (dryer production season) phenomenon increases when the SOI-values are lower than -7 for an extended period of time. The SOI-data for the past three seasons is reflected graphically in Figure 1.
The probability of either an El Niño or La Niña phenomenon on the basis of SOI-figures, is confirmed by measuring sea surface temperatures in the Nino 3.4 area, whereafter these temperatures are compared with the long-term average temperature.
These sea surface temperatures are expressed as a norm by means of monthly Oceanic Niño Index (ONI) values. Every monthly ONI-value is the 3-month average of the sea surface temperature in the Niño 3.4 area. Should 5 consecutive ONI-values be warmer than 0.5° Celsius, an El Niño phenomenon would be identified, but should the ONI-values for 5 consecutive months be cooler than -0.5° Celsius, a La Niña phenomenon would be identified. These values have been classified even further over time to indicate the expected intensity of an El Niño or La Niña phenomenon. The classification is done in 0.5° Celsius intervals, as indicated in Figure 4. This classification makes it possible to classify previous seasons according to the type of season experienced, as summarised in Table 1.


Against this background it becomes possible to create a new expectation for the new season on the basis of various models projecting the development of sea surface temperatures. The average expected sea surface temperature projected at present, indicates that it is estimated that the temperature can be approximate 0.8 degrees Celsiums warmer than normal from November to February. Per definition this expectation indicates a weak El Niño event and the probability of such an event is estimated at 70%.
However, there is an outsider to be taken into account in any consideration which relates to season climate expectations and rainfall. This aspect is the origination and development of tropical cyclones which are known for withdrawing moisture from central South Africa and which have a negative impact on the probability of rain. The causes and measurement of these phenomena are indicated by the East Indian Dipole (EID).
When the EID-value is positive, it will indicate warmer than normal sea surface temperatures against the east coast of Africa. This scenario causes increased evaporation which drives moisture over the country. This moisture results in rain over the Indian Ocean.
The EID-value is positive at present, but the projections of the EID-values during January and March 2019 seem to be neutral, which indicates that tropical cyclones will probably not pose a threat for rainfall during the critical pollination period.
In summary - the objective of this article is not to make a rainfall prediction for the 2018-19 season. The information contained herein is based on actual historic realisations of weather phenomena and models tested over time. The conclusion to be made from the expectations is that the 2018-19 production season will probably be characterised as a weak El Niño season.
However, it is important to evaluate this expectation in context by looking at the impact of an El Niño event on yield over time. This yield expectation can further be linked to rainfall realisation during similar production seasons in the Senwes area. We will specifically look at the impact of a weak El Niño event in the next article.